Skunk#18
RSP 11030
Grower: The Nature Farm
General Information
- Accession Date
- November 19, 2017
- Reported Plant Sex
- Female
- Report Type
- StrainSEEK v2 3.2Mb
- DNA Extracted From
- Stem
The strain rarity visualization shows how distant the strain is from the other cultivars in the Kannapedia database. The y-axis represents genetic distance, getting farther as you go up. The width of the visualization at any position along the y-axis shows how many strains there are in the database at that genetic distance. So, a common strain will have a more bottom-heavy shape, while uncommon and rare cultivars will have a visualization that is generally shifted towards the top.
Chemical Information
Cannabinoid and terpenoid information provided by the grower.
Cannabinoids
No information provided.
Terpenoids
No information provided.
Genetic Information
- Plant Type
- Type I
File Downloads
The bell curve in the heterozygosity visualization shows the distribution of heterozygosity levels for cannabis cultivars in the Kannapedia database. The green line shows where this particular strain fits within the distribution. Heterozygosity is associated with heterosis (aka hybrid vigor) but also leads to the production of more variable offspring. When plants have two genetically different parents, heterozygosity levels will be higher than if it has been inbred or backcrossed repeatedly.
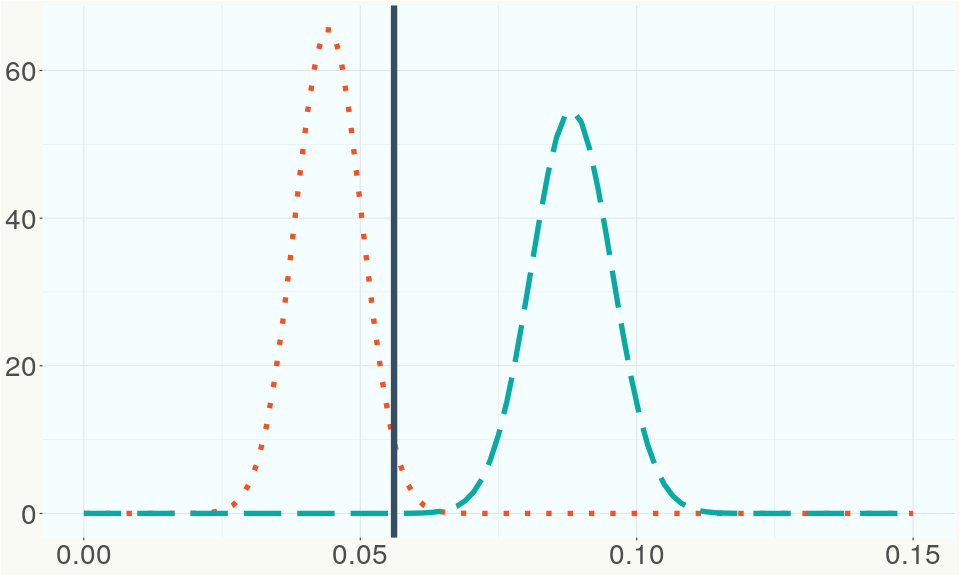
The ratio of reads mapped to Y-contigs to reads mapped to the whole Cannabis genome (Y-ratios) has been demonstrated to be strongly correlated with plant sex typing. This plot shows the distribution of Y-ratios for all samples in our database which were sequenced with the same method (panel or WGS) as this sample and where this sample falls in the distribution.
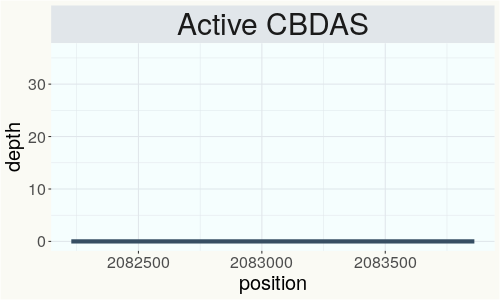
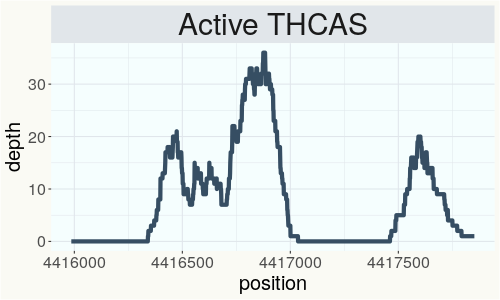
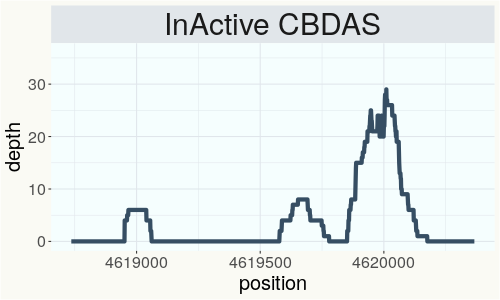
This chart represents the Illumina sequence coverage over the Bt/Bd allele. These are the three regions in the cannabis genome that impact THCA, CBDA, CBGA production. Coverage over the Active CBDAS gene is highly correlated with Type II and Type III plants as described by Etienne de Meijer. Coverage over the THCA gene is highly correlated with Type I and Type II plants but is anti-correlated with Type III plants. Type I plants require coverage over the inactive CBDA loci and no coverage over the Active CBDA gene. Lack of coverage over the Active CBDA and Active THCA allele are presumed to be Type IV plants (CBGA dominant). While deletions of entire THCAS and CBDAS genes are the most common Bt:Bd alleles observed, it is possible to have plants with these genes where functional expression of the enzyme is disrupted by deactivating point mutations (Kojoma et al. 2006).
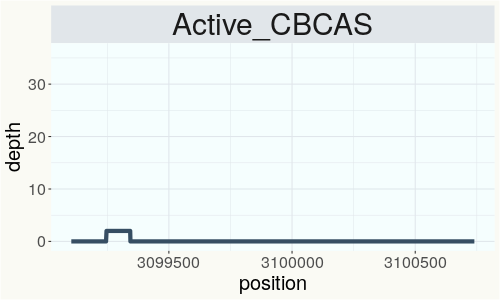
This chart represents the Illumina sequence coverage over the CBCA synthase gene.
Variants (THCAS, CBDAS, and CBCAS)
Variants (Select Genes of Interest)
| PKSG-2a | c.67T>A | p.Phe23Ile | missense variant | moderate | contig700 | 1945567 | A/T | |
| PKSG-2a | c.31A>T | p.Thr11Ser | missense variant | moderate | contig700 | 1945603 | T/A | |
| PKSG-4b | c.496A>G | p.Lys166Glu | missense variant | moderate | contig700 | 2721177 | T/C | |
| PKSG-4b | c.489delT | p.Phe163fs | frameshift variant | high | contig700 | 2721183 | CA/C | |
| PKSG-4b | c.485A>G | p.Lys162Arg | missense variant | moderate | contig700 | 2721188 | T/C | |
| aPT4 | c.775delT | p.Tyr259fs | frameshift variant | high | contig121 | 2831380 | AT/A |
|
| aPT1 | c.406A>G | p.Ile136Val | missense variant | moderate | contig121 | 2839605 | A/G | |
| aPT1 | c.629C>T | p.Thr210Ile | missense variant | moderate | contig121 | 2840237 | C/T | |
| HDS-2 |
c.82_93delGT |
p.Val28_Thr3 |
conservative inframe deletion | moderate | contig95 | 1989748 |
CGTAACCGGAAC |
|
Nearest genetic relatives (All Samples)
- 0.003 Skunk#18 (RSP11038)
- 0.215 RKM-2018-023 (RSP11115)
- 0.229 Square Wave (RSP11344)
- 0.239 CPH (RSP11367)
- 0.244 RKM-2018-003 (RSP11094)
- 0.247 Durban Poison #1 (RSP11013)
- 0.247 Cheese (RSP10460)
- 0.248 UnObtanium (RSP11611)
- 0.251 Trump x Trump (RSP11466)
- 0.254 BLACK JACK (RSP11346)
- 0.254 Golden Goat 2 (RSP10991)
- 0.254 RKM-2018-027 (RSP11119)
- 0.259 CBG-#40 (RSP11444)
- 0.259 Durban Poison #1 (RSP10996)
- 0.260 Gold Cracker (RSP11048)
- 0.261 Glueberry OG (RSP11222)
- 0.261 Dominion Skunk (RSP11354)
- 0.262 Gold Cracker (RSP11041)
- 0.263 Domnesia (RSP11184)
- 0.263 Black Jack (RSP10603)
Most genetically distant strains (All Samples)
- 0.470 Cherry Blossom (RSP11306)
- 0.468 Cherry Blossom (RSP11317)
- 0.460 Cherry Blossom (RSP11323)
- 0.459 Cherry Blossom (RSP11308)
- 0.457 Cherry Blossom (RSP11311)
- 0.456 Cherry Blossom (RSP11318)
- 0.455 Cherry Blossom (RSP11335)
- 0.453 Cherry Blossom (RSP11330)
- 0.449 CS Indica (RSP11658)
- 0.447 Cherry Blossom (RSP11322)
- 0.445 Cherry Blossom (RSP11333)
- 0.440 Feral (RSP11205)
- 0.440 Cherry Blossom (RSP11325)
- 0.436 Cherry Blossom (RSP11314)
- 0.434 Chem 91 (RSP11185)
- 0.434 Cherry Blossom (RSP11324)
- 0.432 Tiger Tail -30- (RSP11484)
- 0.432 Cherry Blossom (RSP11334)
- 0.431 Cherry Blossom (RSP11328)
- 0.429 Chematonic -Cannatonic x Chemdawg- (RSP11394)
Nearest genetic relative in Phylos dataset
- Overlapping SNPs:
- 112
- Concordance:
- 71
Nearest genetic relative in Lynch dataset
- Overlapping SNPs:
- 11
- Concordance:
- 11
Blockchain Registration Information
- Transaction ID
-
f7066261ba3789e1
81f6cbcbc72e4c71 2e29e8722dfe9218 eaa92b5a074321ef - Stamping Certificate
- Download PDF (857.9 KB)
- SHASUM Hash
-
ee133b652522a3a540ee2a9d8f8f332c a8e28202220b3d12 a989c5371c83fd66
