KYRG-21
RSP 11053
Grower: Landrace kyrgyzstan
General Information
- Sample Name
- Kyrgyz-T*
- Accession Date
- February 5, 2018
- Reported Plant Sex
- not reported
- Report Type
- StrainSEEK v2 3.2Mb
- DNA Extracted From
- Stem
The strain rarity visualization shows how distant the strain is from the other cultivars in the Kannapedia database. The y-axis represents genetic distance, getting farther as you go up. The width of the visualization at any position along the y-axis shows how many strains there are in the database at that genetic distance. So, a common strain will have a more bottom-heavy shape, while uncommon and rare cultivars will have a visualization that is generally shifted towards the top.
Chemical Information
Cannabinoid and terpenoid information provided by the grower.
Cannabinoids
No information provided.
Terpenoids
No information provided.
Genetic Information
- Plant Type
- Type I
File Downloads
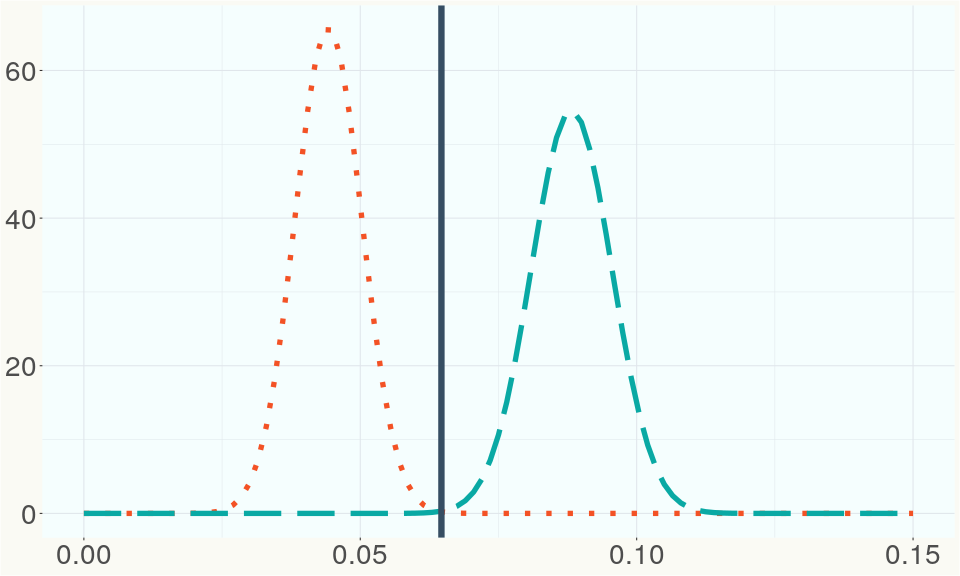
The bell curve in the heterozygosity visualization shows the distribution of heterozygosity levels for cannabis cultivars in the Kannapedia database. The green line shows where this particular strain fits within the distribution. Heterozygosity is associated with heterosis (aka hybrid vigor) but also leads to the production of more variable offspring. When plants have two genetically different parents, heterozygosity levels will be higher than if it has been inbred or backcrossed repeatedly.
The ratio of reads mapped to Y-contigs to reads mapped to the whole Cannabis genome (Y-ratios) has been demonstrated to be strongly correlated with plant sex typing. This plot shows the distribution of Y-ratios for all samples in our database which were sequenced with the same method (panel or WGS) as this sample and where this sample falls in the distribution.
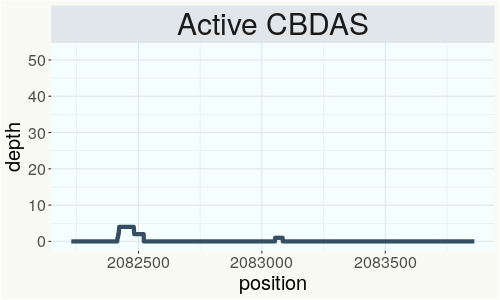
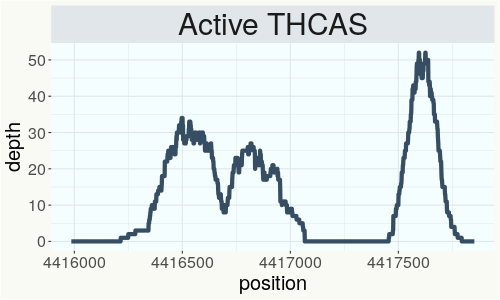
This chart represents the Illumina sequence coverage over the Bt/Bd allele. These are the three regions in the cannabis genome that impact THCA, CBDA, CBGA production. Coverage over the Active CBDAS gene is highly correlated with Type II and Type III plants as described by Etienne de Meijer. Coverage over the THCA gene is highly correlated with Type I and Type II plants but is anti-correlated with Type III plants. Type I plants require coverage over the inactive CBDA loci and no coverage over the Active CBDA gene. Lack of coverage over the Active CBDA and Active THCA allele are presumed to be Type IV plants (CBGA dominant). While deletions of entire THCAS and CBDAS genes are the most common Bt:Bd alleles observed, it is possible to have plants with these genes where functional expression of the enzyme is disrupted by deactivating point mutations (Kojoma et al. 2006).
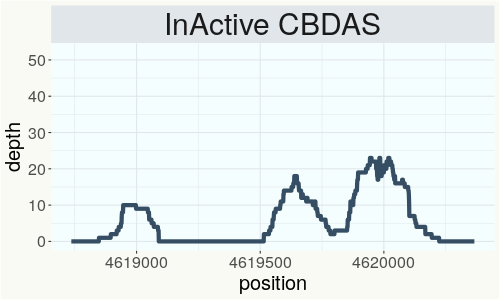
This chart represents the Illumina sequence coverage over the CBCA synthase gene.
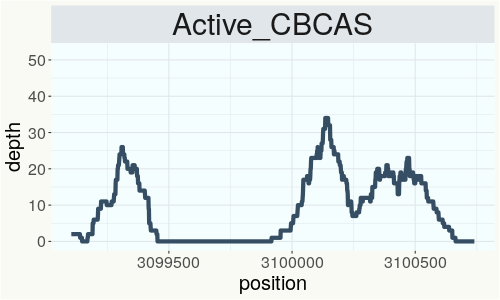
Variants (THCAS, CBDAS, and CBCAS)
Variants (Select Genes of Interest)
| PKSG-2a | c.67T>A | p.Phe23Ile | missense variant | moderate | contig700 | 1945567 | A/T | |
| aPT1 |
c.95_97delGT |
p.Cys32del | disruptive inframe deletion | moderate | contig121 | 2835800 | ATGT/A | |
| aPT1 | c.406A>G | p.Ile136Val | missense variant | moderate | contig121 | 2839605 | A/G | |
| aPT1 | c.629C>T | p.Thr210Ile | missense variant | moderate | contig121 | 2840237 | C/T |
Nearest genetic relatives (All Samples)
- 0.193 KYRG-151 (RSP11052)
- 0.224 Tygra (RSP10667)
- 0.225 KYRG-11 (RSP11051)
- 0.227 Lovrin (RSP10658)
- 0.228 Tisza (RSP10659)
- 0.228 Fedora 17 (RSP10661)
- 0.228 XHC2 (SRR14708210)
- 0.229 XGL1 (SRR14708209)
- 0.231 XHC1 (SRR14708212)
- 0.232 XUM1 (SRR14708205)
- 0.233 Santhica27 (RSP10056)
- 0.234 Ferimon 12 (SRR14708233)
- 0.235 Carmagnola (RSP10982)
- 0.237 Carmagnola (RSP11039)
- 0.237 Kyrgyz Gold (RSP11054)
- 0.237 C-930 lot 211005 (RSP12603)
- 0.238 XUM2 (SRR14708204)
- 0.239 Tisza (RSP11045)
- 0.239 Tak-HN (RSP11618)
- 0.239 XGL2 (SRR14708208)
Most genetically distant strains (All Samples)
- 0.442 Cherry Blossom (RSP11318)
- 0.438 Cherry Blossom (RSP11323)
- 0.437 Cherry Blossom (RSP11300)
- 0.432 Cherry Blossom (RSP11312)
- 0.429 Cherry Blossom (RSP11298)
- 0.427 Cherry Blossom (RSP11301)
- 0.426 Cherry Blossom (RSP11311)
- 0.424 Cherry Blossom (RSP11328)
- 0.415 Cherry Blossom (RSP11331)
- 0.413 Cherry Blossom (RSP11302)
- 0.412 Unknown--Cherry Wine---001- (RSP11268)
- 0.412 Unknown--Cherry Wine---002- (RSP11269)
- 0.411 Chem 91 (RSP11185)
- 0.410 Cherry Blossom (RSP11309)
- 0.409 Cherry Blossom (RSP11316)
- 0.407 BagSeed (RSP12627)
- 0.406 Cherry Blossom (RSP11308)
- 0.404 Cherry Blossom (RSP11274)
- 0.404 Cherry Blossom (RSP11333)
- 0.404 GG4 (RSP11978)
Nearest genetic relative in Phylos dataset
- Overlapping SNPs:
- 109
- Concordance:
- 72
Nearest genetic relative in Lynch dataset
- Overlapping SNPs:
- 2
- Concordance:
- 2
Blockchain Registration Information
- Transaction ID
-
b5dd0a815d6a94de
1189f99e8b294715 fd141a6c6c820986 e2c42f13b45c5402 - Stamping Certificate
- Download PDF (857.6 KB)
- SHASUM Hash
-
88a0a2e6579d087b1a5b054401aa7c99 94d6b67b25da09bf 9adf9eb2b3e7d9c6